
Explainer: The Heritatum Rare Coin Index
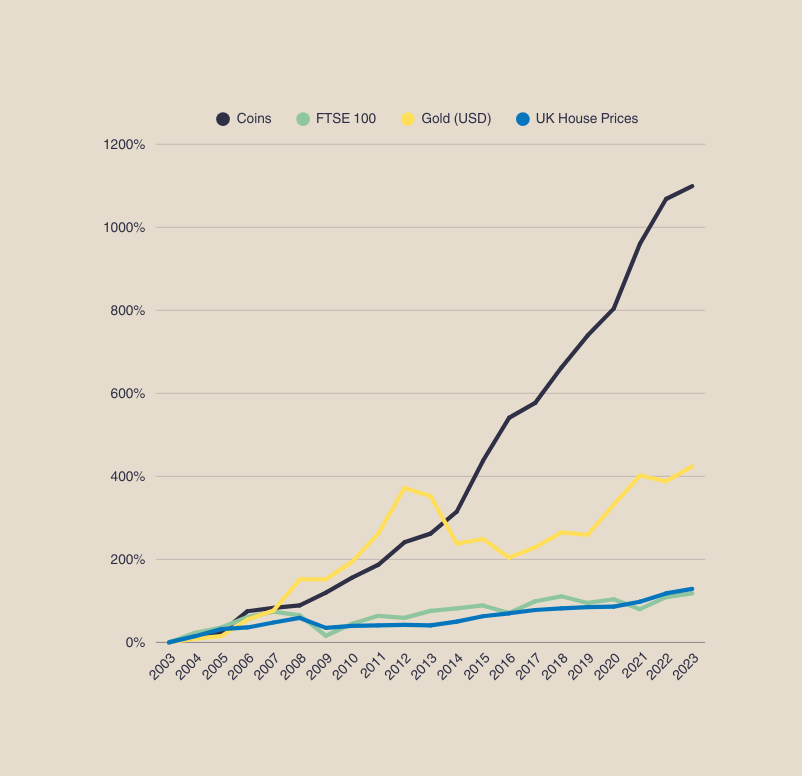
The Heritatum Rare Coin Index (HRCI) 2003-2023
The Problem & Our Solution.
Whilst those ‘in the know’ are aware of the impressive last performance of rare coins and there are several iconic coins that people remember trading at ‘x price’ and are now worth ‘y price’ when it comes to most coins there is no benchmarked index if price histories. Although we feel the market is more nuanced that any index can demonstrate it is none the less and important tool to highlight the impressive long term performance of the rare British coin market.
When trying to create a representative index of high grade rare coins, of the type suitable for investment purposes, there were serious challenges in relation to methodology and data. Unlike say fine wine, where every bottle of wine from a specific vineyard, of a specific type and of a specific year is standardised - no such scenario exists for coins older than 50 years old (where production methods and storage solutions have since improved). This means every coin is unique in nature (whether it be strike, condition, lustre, tarnishing or a combination of these). This meant we needed a standardised and unbiased list of coins going back at least 20 years. Fortunately this existed in the form of Spinks (previously Seaby’s and now Sovereign Rarities) ‘Coins of England’. This is an annual catalogue which contains the majority of British coins in existence (going back to Celtic times) with prices relating to the British grading system. Spink is exclusively an auction house so have no motive to inflate prices and rather need to make an honest reflection to keep credibility. As Spink have been producing this publication consistently for some time we can also be confident that the methodology for pricing is consistent.
With this in mind we went about constructing the methodology for the Heritatum Rare Coin Index (HRCI).
Methodology.
Stage 1.
Whilst we could have looked at the data and then decided what was most favouarble we wanted to set the parameters early.
Our first decision was to include only gold coins. Whilst there are many silver coins which are worthy of being included this would have involved ‘picking and choosing’ which went against the methodology. This decision meant we would focus on coins only created since 1344 when gold coins were produced in any meaningful way in England (as it was then).
We established a further issue at this stage. Spink use the British grading system and for hammered coins they do not price in the higher grades (as these are much rare and for many coins the higher quality simply does not exist). Condition is one of the key ‘pillars’ when considering any coin for investment purposes so it seemed at odds to include these in the index. We therefore decided to only include the more uniformly produced milled coins which the provided us with a start point.
We had also to consider the end point. With a change of direction at the Royal Mint, and the vast increase in issued coins this created, to include the coins of Elizabeth II would simply make the Index to heavily weighted towards one (rather extensive) time period. The same arguement could be made (to a lesser extent) for the coins of Queen Victoria and in this instance it would have again resulted in being selective which would go against the methodology so we felt we must stop the index at William IV.
Stage 2.
Now that we had the basis for our Index we needed to look at which coins to include.
As before we needed this index to be as broad as possible without any selective choices. At the same time including all coins produced between 1662 (the start of milled coinage) and 1837 (the end of William IV’s reign) was an unrealistic prospect. The primary denominations in this period are Guineas and Sovereigns ranging from 5 through to singles (5 being 5 times the weight of a single). Each reign includes multiples years and at times variations of design so this further cements the point on the quantity.
Based on the above, and with a need to not be selective, we decided the most representative option was to include the first type of each denomination from each Monarch - this meant that we would miss many of the rarer issues and with this the likely best performers but that works with the ethos of the index. This was always intended as a ‘broad stroke’ which would be supported by further research.
With these decisions in hand we compiled the index from 2003 through 2023.
Brief overview of performance.
The results of our research whilst not surprising to us were reassuring to see. The main take aways were as follows;
20 year growth of 1099%
Compound Returns of 13.16%
12 times multiplier since 2003
Best Performance of 3233%
It must be remembered that is simply a demonstration of the market for this material and by being selective returns would have surpassed these figures. It demonstrates the health of the market over the last 20 years. Why this is can be viewed through our other Journal entries.
Important Information & Risk Disclosure
The content provided by Heritatum is for informational and educational purposes only and does not constitute financial, investment, or tax advice. Rare coins are tangible assets and should be viewed as a long-term diversification strategy rather than a traditional liquid investment. Tax treatment depends on individual circumstances and may be subject to change. We recommend consulting with a qualified tax professional